
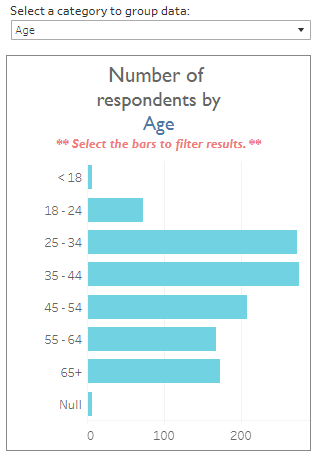
Select a category from the first drop-down menu to update the “Number of” bar chart with the number of responses by group in that category. The length of each bar represents the number of respondents that group. There is a “Total” option in the list if you want to see all responses together.
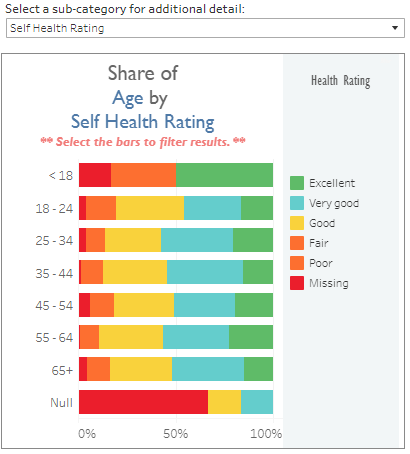
Select a sub-category from the second drop-down menu to update the “Share of” stacked bar chart with the percentages of the sub-category groups within each initial category group. The length of each different colored bar represents the share (i.e. percentage) of a sub-category group within the initial group. Each bar sums to 100%. There is a “None” option in the list if you do not wish to break out the data into a sub-category.
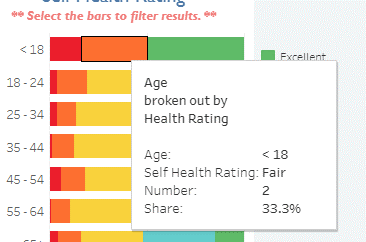
Hover over various parts of each chart/map to see a “ToolTip” with details on the data represented by your selections.
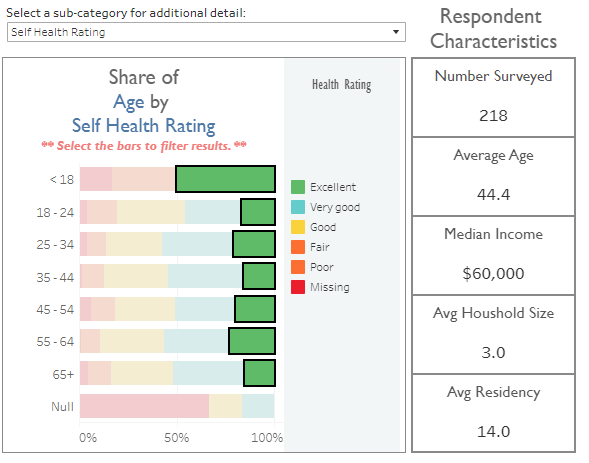
Click on the bar charts to filter the rest of the visualization for a particular group of respondents. Use Ctrl+Click to select multiple groups at the same time.
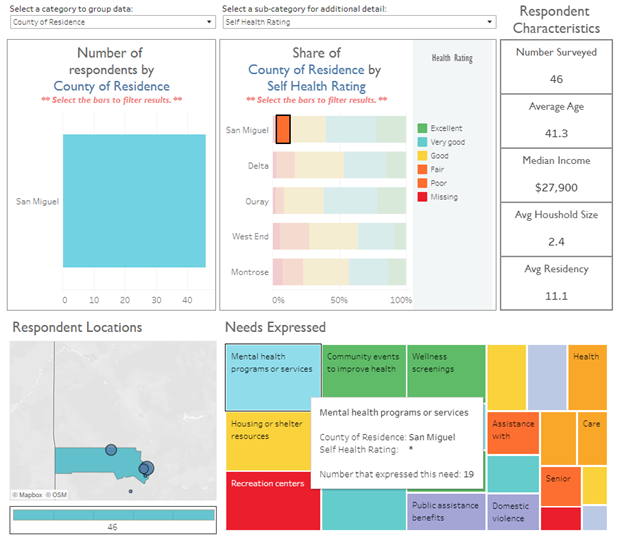
Click on the bar charts to filter, the “Repsondent Characteristics,” “Respondent Locations,” and “Needs Expressed” sections of the visualization. They will update to show the data associated with the selected sub-group of respondents. Hover over the charts or numerical values for details.
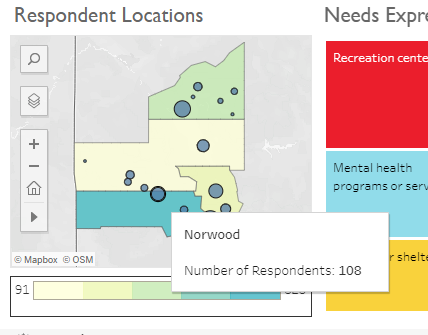
Hover over the circles on the “Respondent Locations” map to see details of the number of respondents by town of residence. The size of the circles represents the number of respondents from each town in the filtered selection.
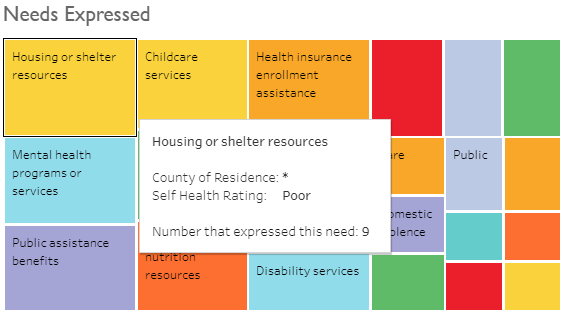
Hover over the colored rectangles in the “Needs Expressed” chart to see details on the number of respondents that expressed a need for various services in their area. This chart will update based on the filter selection.
Use the icons at the bottom right to Undo, Reset, Share, Download, or Maximize the visualization.